How to view Sales Analytics on the ChowNow Dashboard
To get to the Analytics page, log into the ChowNow Dashboard and under your Headquarters view, navigate to Reports > Analytics.
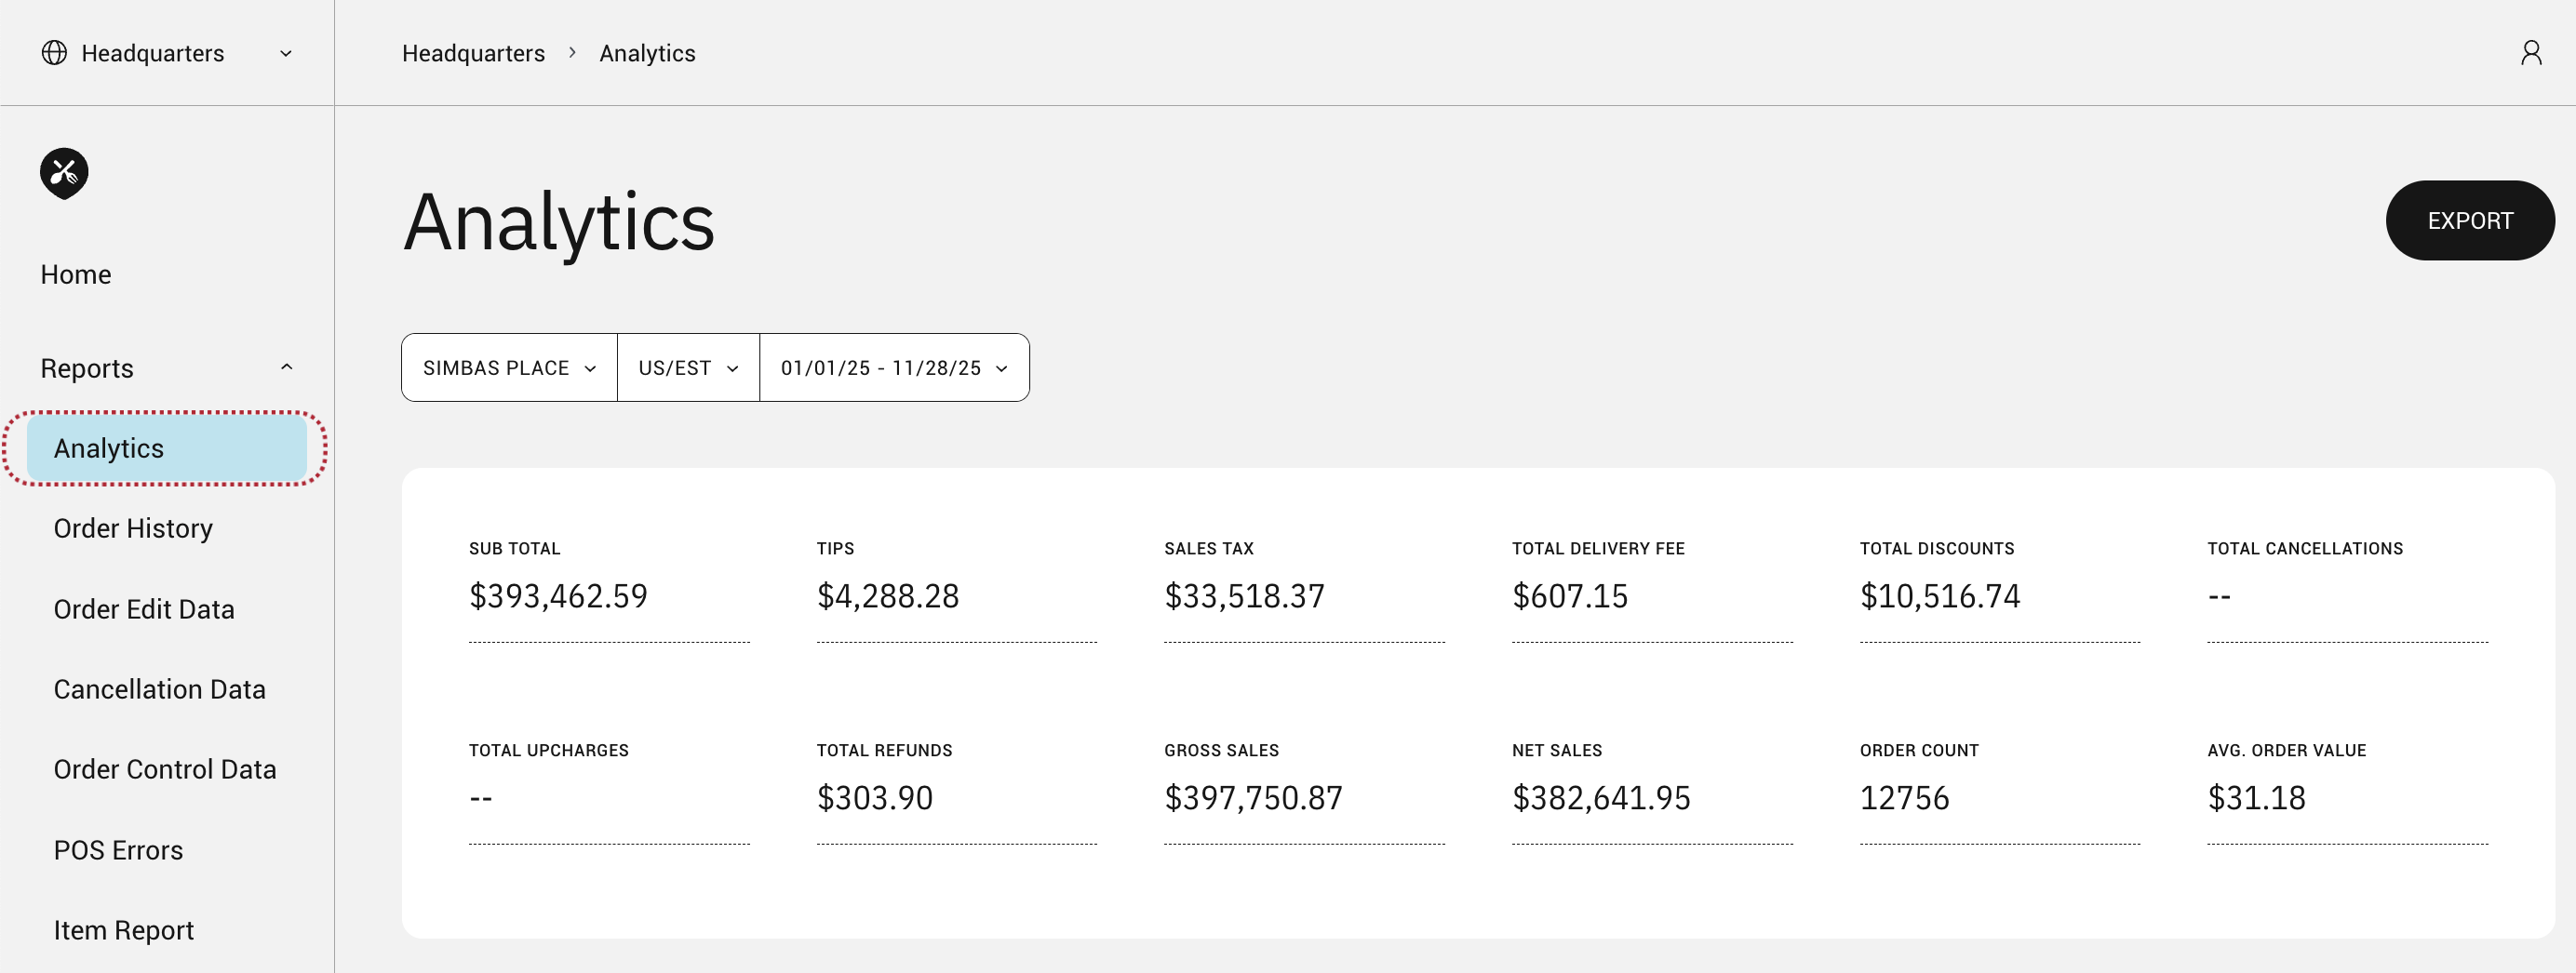
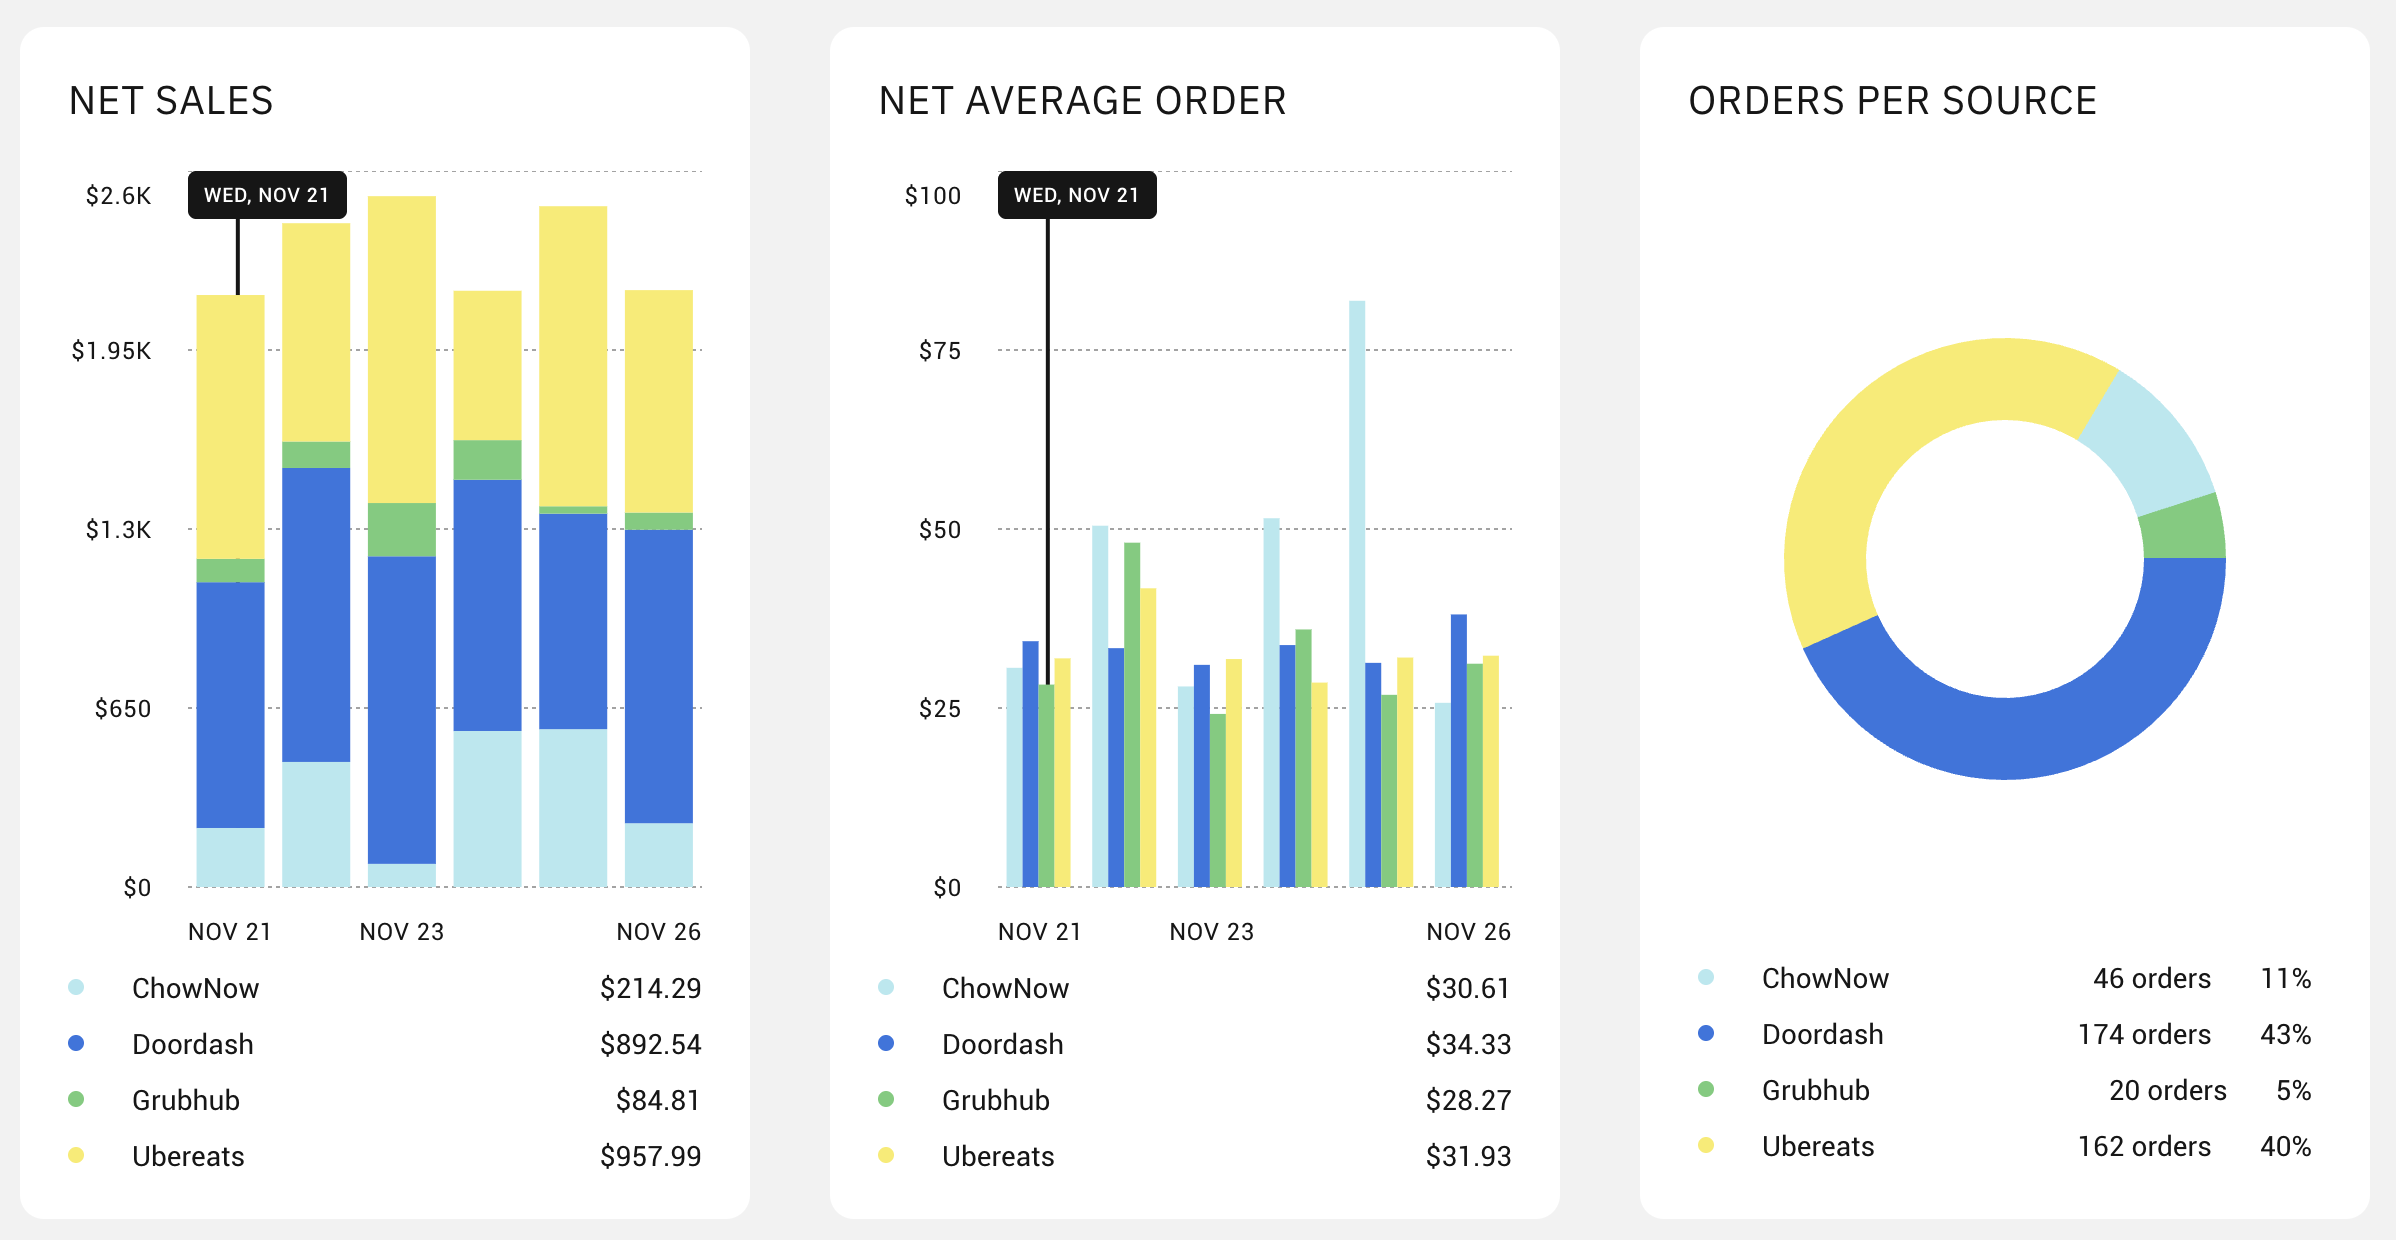
On the Analytics page you can:
- Compare gross and net sales across a selected time period
- Compare performance across each source
- View the average order amount
- Identify your peak order times with an hour by hour breakdown
- Export your sales data
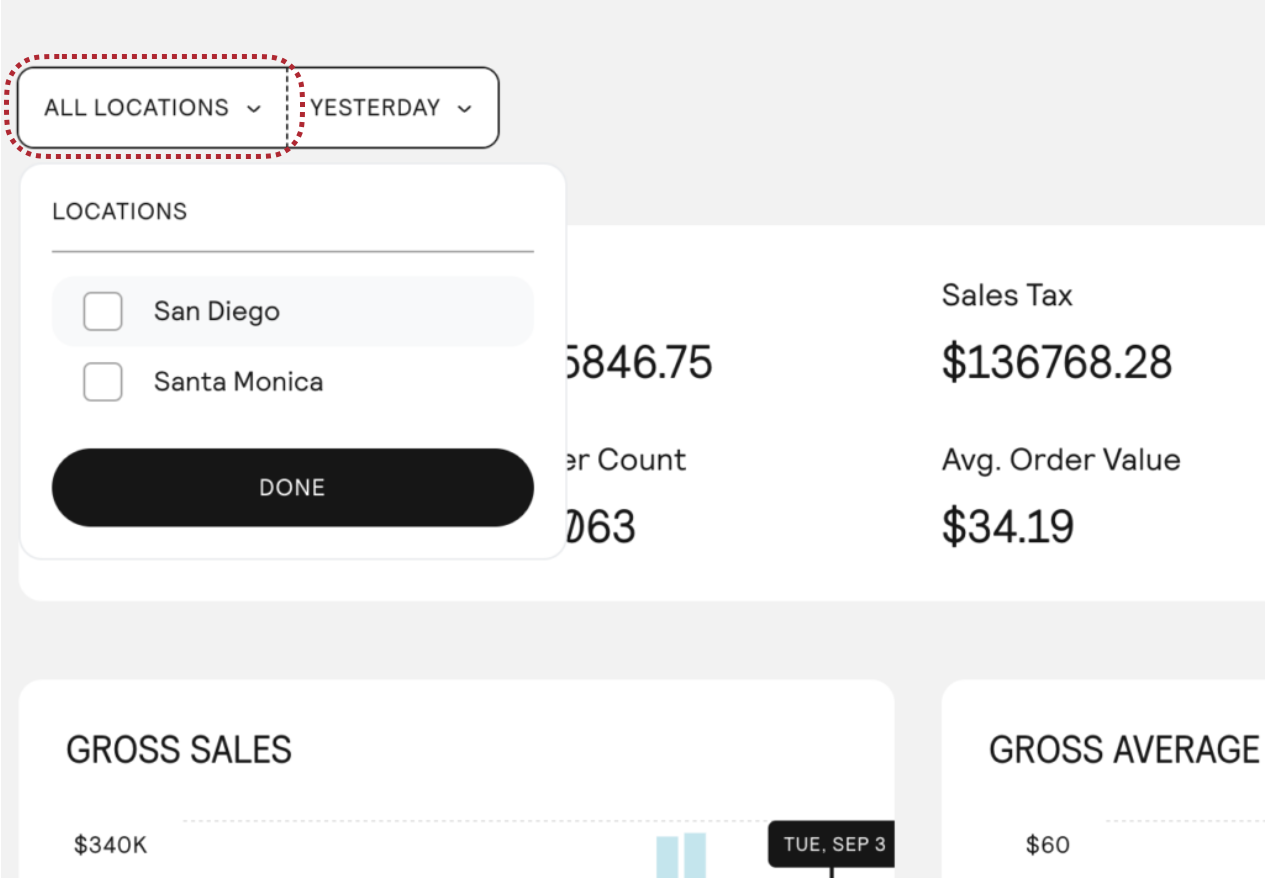
First, click the ALL LOCATIONS button to select either a single location or multiple locations to view their sales data.
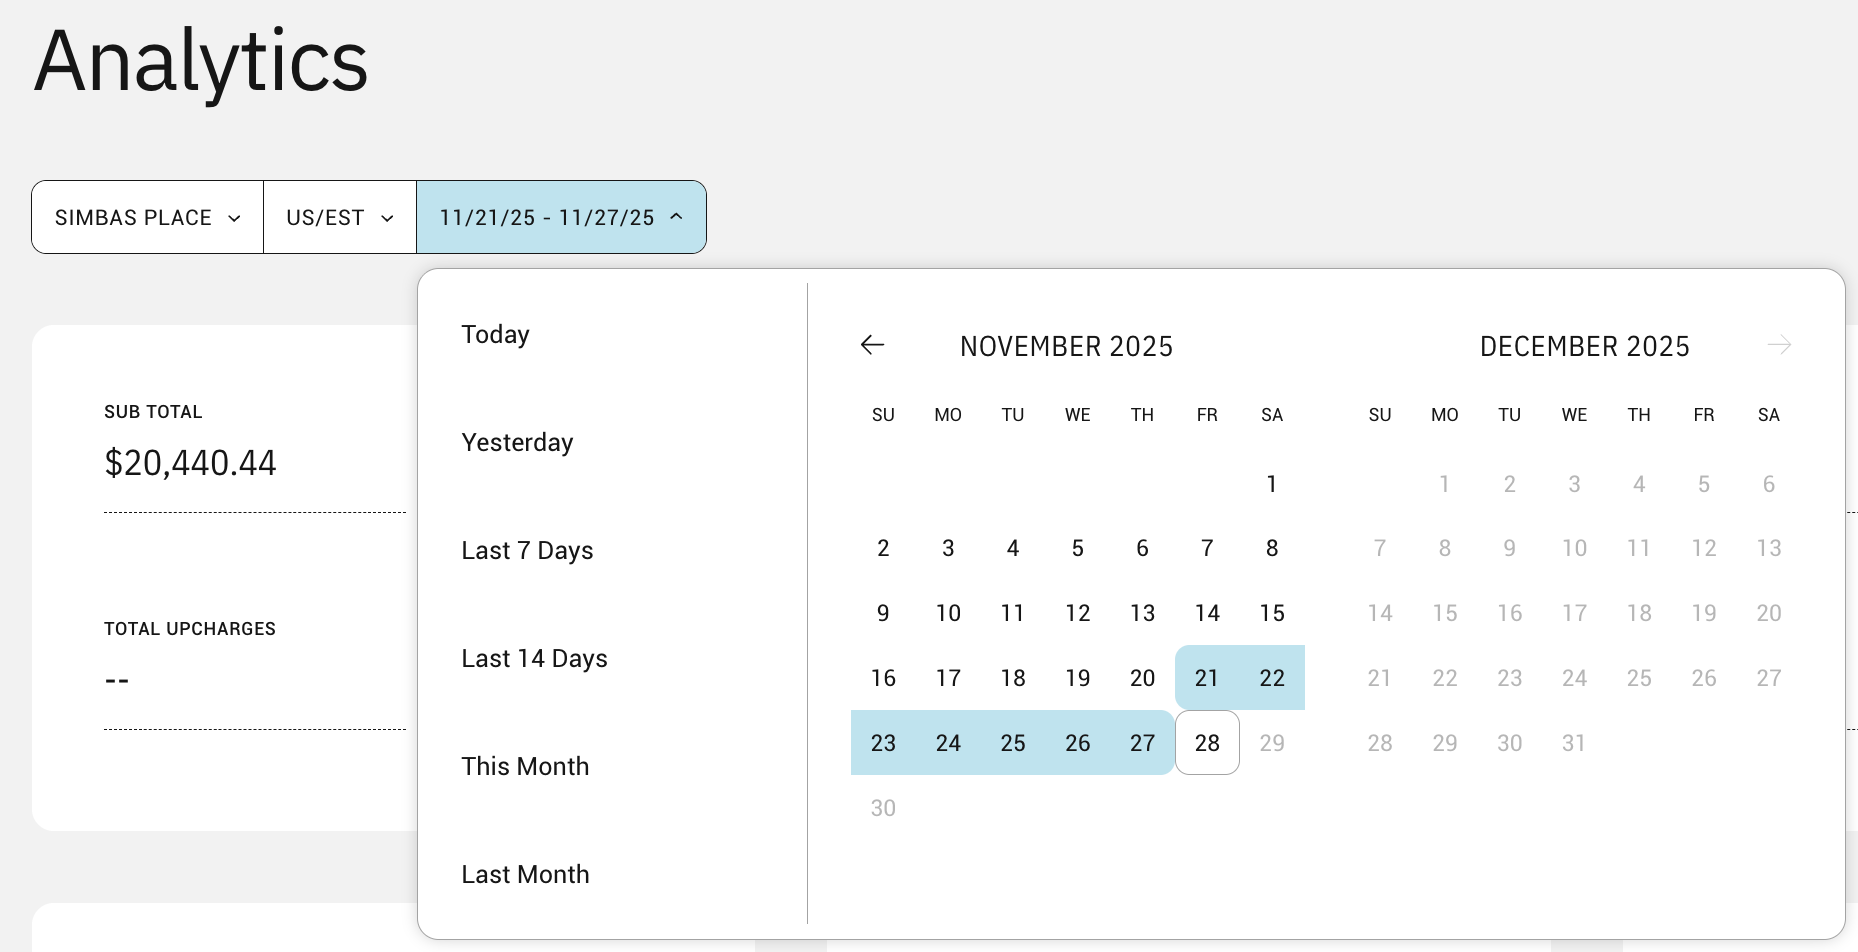
Next, select a date range that you wish to view.
Hover over any of the visualizations to learn more.

Frequently Asked Questions
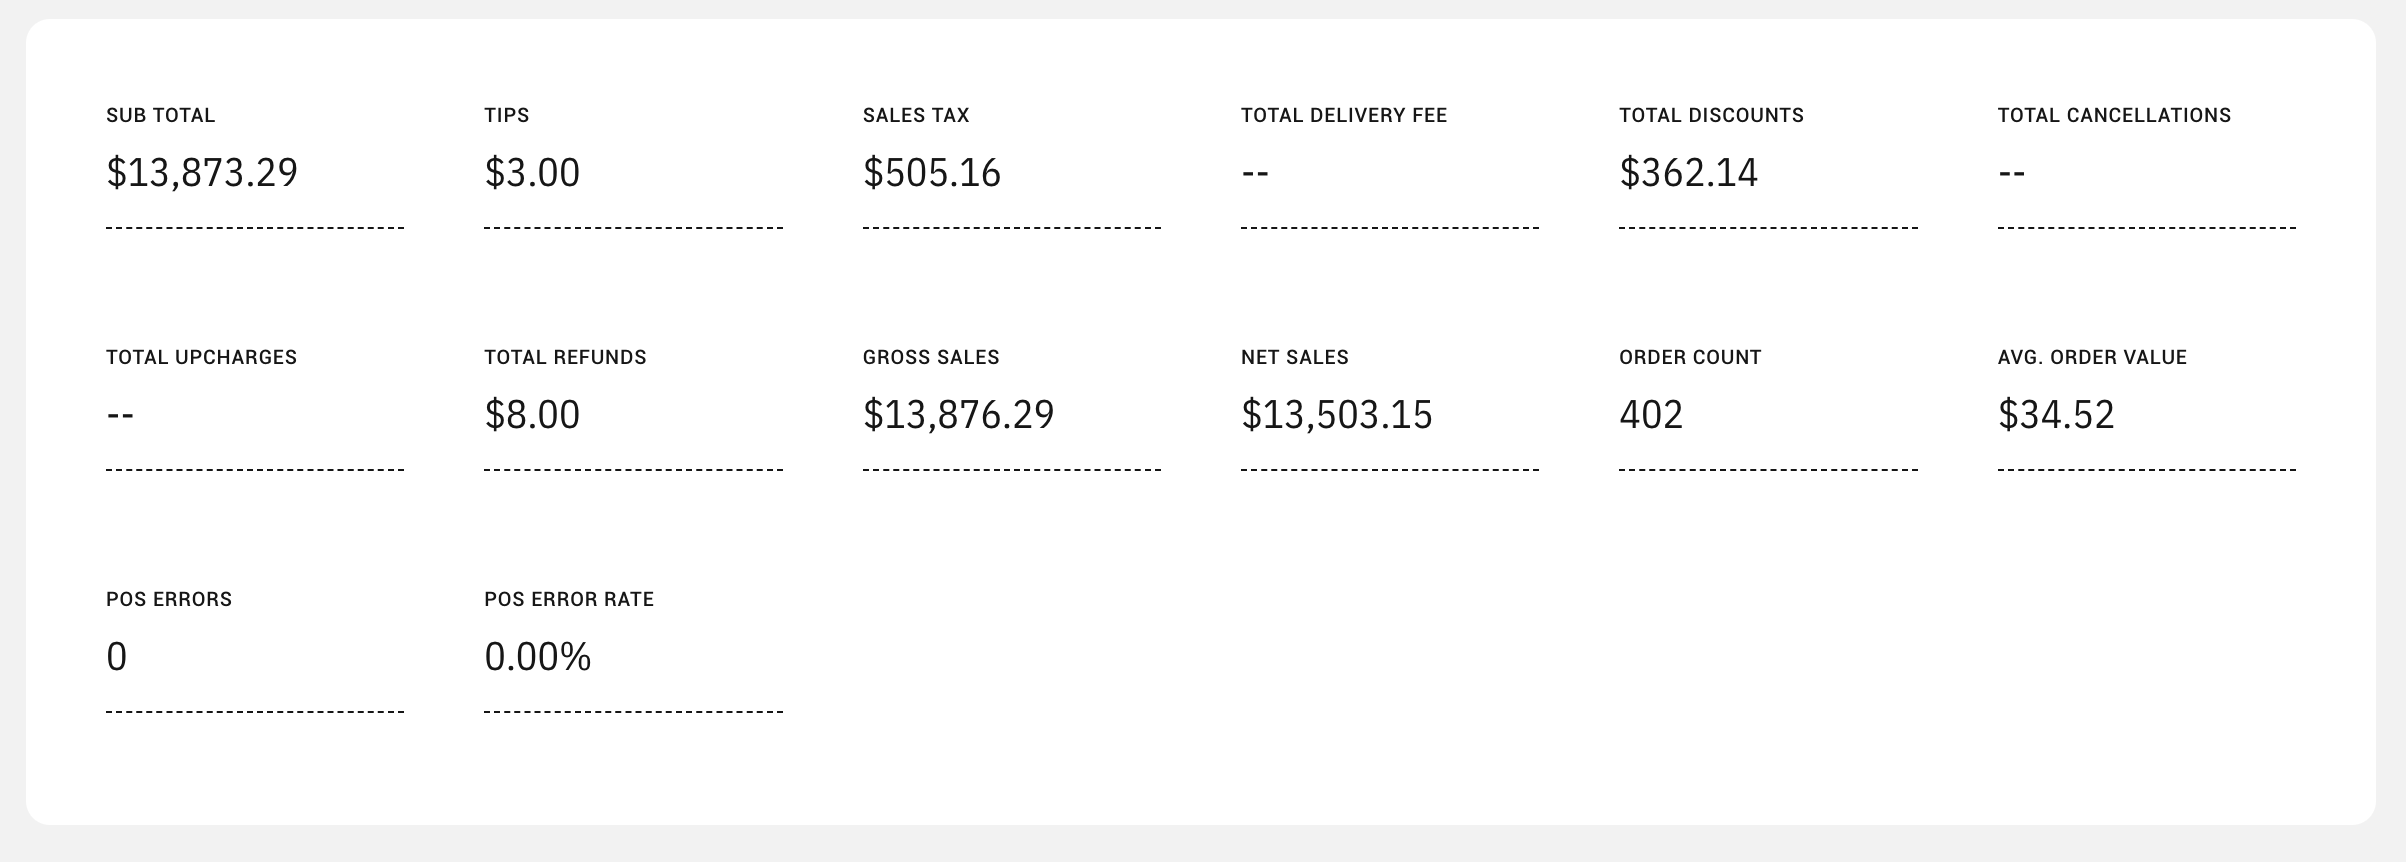
How do you calculate “net” sales?
The net amount is the gross sales amount minus refunds, discount, tips, and cancellations.
How far back in the past can I select?
You are able view sales data starting from your first day on ChowNow.
How do I export my sales data?
Click on the ‘EXPORT’ button in the top right hand corner of the Analytics page to export your sales data into a .csv file.