How to Track and Grow Your Restaurant’s Online Ordering Revenue

Online orders leave a paper trail. Every order tells you what sold, when, and to whom. Most restaurants just aren’t looking at it. Here’s what to track, and what to do once you see it.
How do restaurants measure online ordering performance?
Restaurants measure online ordering performance by looking at a small set of numbers together, not in isolation: total revenue, order volume, average order value, and how many orders come from returning diners versus new ones. Any one of these on its own is a data point.
Together, they tell you whether your ordering business is actually growing or just staying busy. If you want the full list of formulas behind these metrics, our restaurant KPI guide and our online ordering KPI breakdown cover those in depth.
How do you track online ordering revenue and trends?
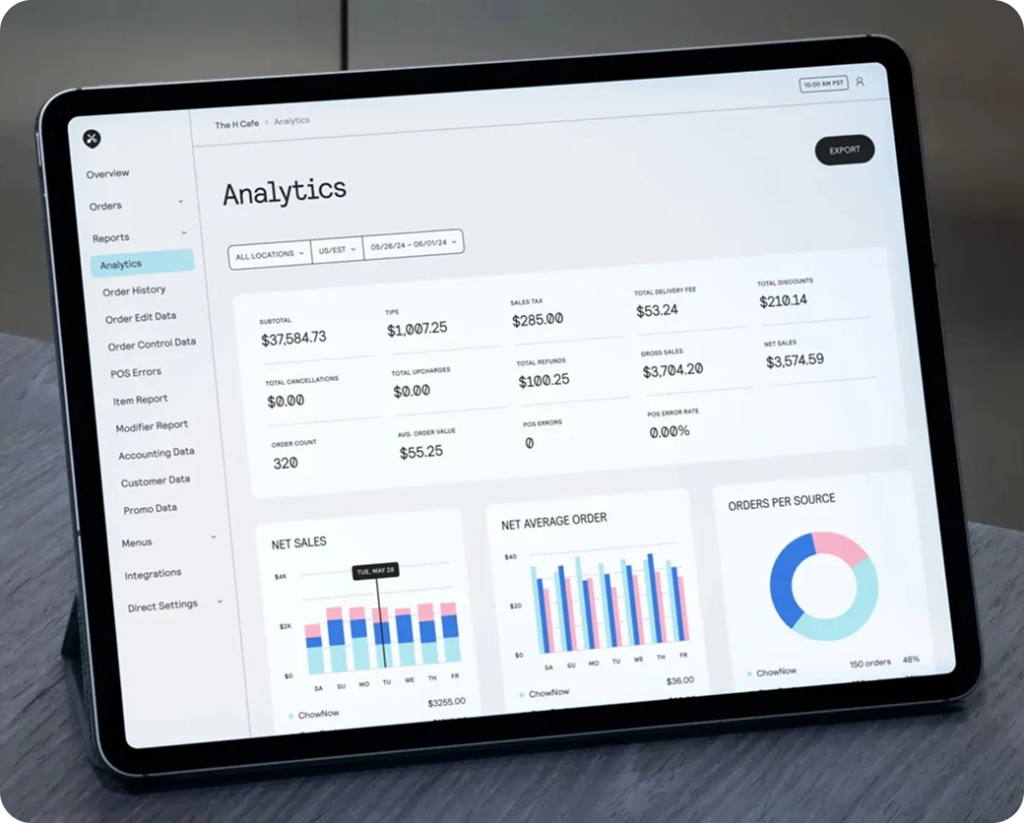
You track online ordering revenue by comparing it over time, not by checking a single day’s total. Pull weekly and month-over-month revenue by channel (your website, your app, and delivery marketplaces) so you can see which channel is actually growing and which one is flat.
A single dashboard view, like the one in ChowNow’s Advanced Reporting, turns this into a two-minute weekly check instead of a spreadsheet project. Look for patterns tied to day of week, time of day, and promotions. A dip after a slow Tuesday means nothing. A dip that repeats every Tuesday for a month means something.

Why the channel split matters: Restaurants shifting orders to direct channels save an average of $16,000 a year in commissions. You can’t see that shift without tracking revenue by channel.
How do you track your restaurant’s best-selling menu items?
You track your best-sellers by pulling an item-level sales report and sorting by units sold and by profit contribution, since your most popular dish and your most profitable one aren’t always the same. A burger that sells 200 times a week at a thin margin may matter less to your bottom line than a pasta dish that sells 60 times at double the margin.
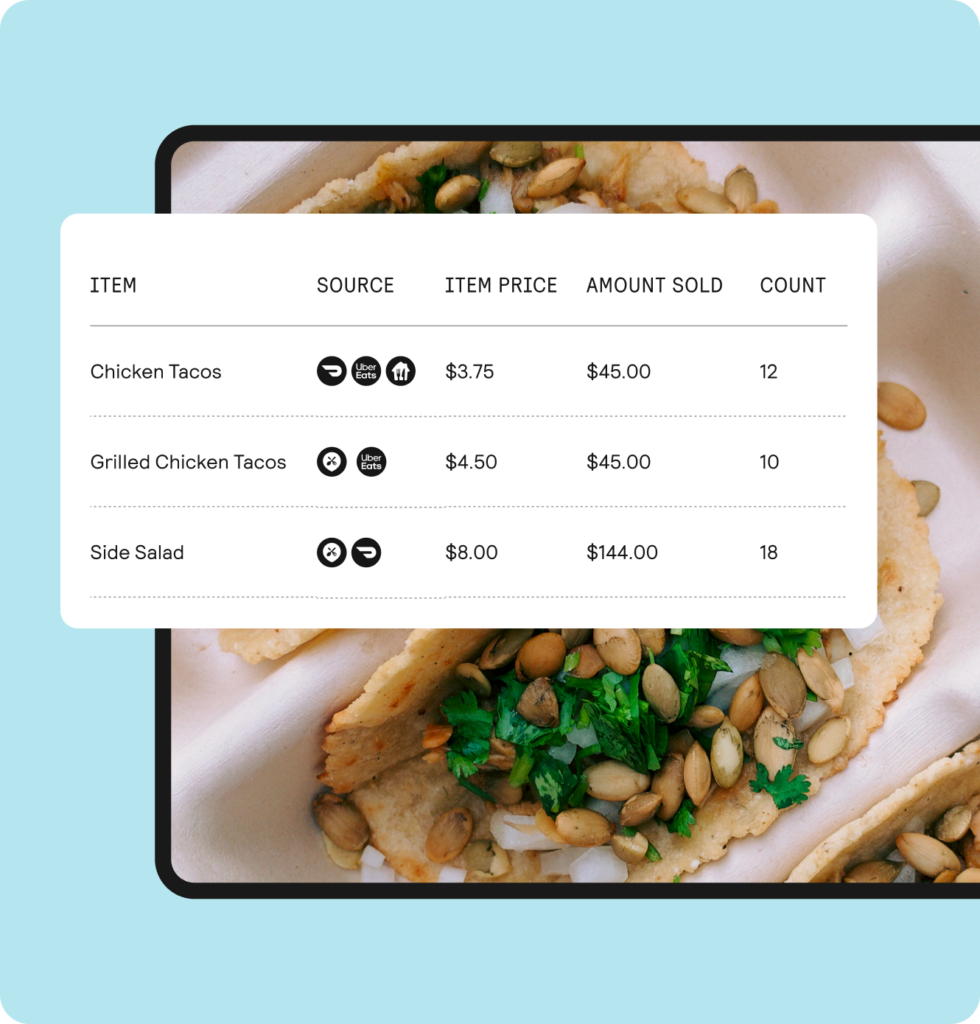
For the full method of turning that report into pricing and menu decisions, our menu engineering guide walks through it step by step.
How do you identify your restaurant’s most valuable customers?
You identify your most valuable customers by combining two numbers: how often someone orders, and how much they spend each time. A diner who orders weekly at $25 a visit is worth more to you over a year than someone who spends $80 once and never comes back, and your reporting should make that visible, not buried in a general customer list.
Our guide to restaurant customer lifetime value covers the calculation in full. Once you know who those diners are, a rewards program gives you a built-in way to keep them coming back, without building a loyalty system from scratch.
How can restaurants use data to increase sales?
Restaurants use data to increase sales by turning each metric into a specific action instead of just reporting it. Once you’ve pulled the numbers above, here are four quick wins worth acting on the same week you find them:
- Rising AOV from a bundle promo? Run it again.
- A best-seller with thin margins? Nudge the price or portion slightly.
- A slow channel next to a growing one? Check your menu listing before assuming it’s a demand problem.
- A cluster of high-value repeat diners? Email them about a new dish first.
That last step is where email & SMS Marketing closes the loop between what you know and what you do about it. For a deeper look at connecting specific campaigns to specific revenue, see our guide to restaurant marketing ROI
KPI cheat sheet
FAQ
Where do restaurants actually get insights from their order data?
From one centralized view whenever possible. Checking your website, your app, and each delivery marketplace separately means you’re comparing numbers by memory instead of side by side. Order Aggregation and Advanced Reporting exist specifically to pull all of it into one dashboard.
How often should restaurants check their online ordering data?
Revenue and channel mix, weekly. Best-sellers and customer value, monthly. Anything more frequent than that is noise for most independent restaurants; anything less and you’ll miss a trend while it’s still small enough to fix.
I don’t have time to build reports for my restaurant. Where do I start?
Start with one number: revenue by channel, this week versus last week. That single comparison, checked consistently, catches more problems and opportunities than a report nobody reads.
Want to see your revenue, best-sellers, and repeat customers in one dashboard instead of three? Book a free demo.