Restaurant Industry Benchmarks: How To Measure, Understand, And Improve Your Performance

At their core, restaurant industry benchmarks are reference points—numbers drawn from across the industry that show what’s typical for restaurant KPIs like profit margin, food cost percentage, or labor costs.
Think of them as a ruler: they don’t tell you exactly how to run your restaurant business, but they give you a way to measure your own restaurant performance against industry standards.
Without clear financial benchmarks, restaurant owners are essentially flying blind.

You might think your costs are under control or your profitability looks healthy, but without context, there’s no way to know if you’re outperforming other restaurant types or lagging behind.
Benchmarks give you the clarity to identify areas for improvement, track success over time, and make smarter decisions that lead to stronger revenue and healthier operations.
In this article, you will learn:
- Financial benchmarks every operator should monitor
- Operational metrics that highlight strengths and identify areas for improvement
- Customer experience data that ties directly to revenue and retention
Financial Benchmarks Every Restaurant Should Track

Your dining room can be full from open to close, but it’s your numbers that tell you if your restaurant business is actually profitable.
By monitoring the right financial benchmarks, you can compare them to industry standards to spot problems before they get out of hand and find opportunities for long-term improvement.
Average profit margins across restaurant types
Profit margin measures how much of your total revenue remains as profit once all costs are covered. It’s one of the most important indicators of financial performance, but what’s considered “good” depends on your restaurant type.
Here’s a general breakdown:
- Quick Service Restaurant (QSRs): 6% to 9% profit margin
- Fast Casual Restaurants: 2% to 6% profit margin
- Fine Dining: 5% to 10% profit margin
- Full Service Restaurant (FSR): 3% to 9% profit margin
Knowing your margin by segment helps you benchmark your own restaurant performance against what’s typical in the restaurant industry.
Tracking your food cost percentage
Your food cost percentage is the share of total sales that goes toward ingredients. For most restaurants, this figure falls between 25% to 35%, but it can vary based on restaurant concept, menu offerings, and location.
Food cost management means monitoring your pricing, portioning, and sourcing to keep costs in line so you can reach your profit goals. Even a few points above the norm can wipe out your profit margin, which is why this metric is one of the most closely watched in the industry.
Labor cost percentage across service models
Labor cost is one restaurant’s largest expenses and, on average, makes up 20% to 30% of total revenue, though the exact percentage depends heavily on the service model:
- Quick service restaurants: Often closer to 25% thanks to limited staff needs
- Full-service restaurants: Generally a little higher, 25% to 30%, due to more employees in both kitchen and front of house.
- Fine dining establishments: Labor-intensive models, combined with higher skill requirements, can push percentages to 30% to 35%.
Tracking labor cost percentage consistently helps managers see how changes, like wage increases or scheduling adjustments, affect overall costs, and whether those shifts are putting too much pressure on profit margins.

What is prime cost and why it matters
Prime cost adds your total food cost and labor costs together, then measures that number as a percentage of your total sales. These two expenses usually make up the majority of a restaurant’s budget—and unlike rent or utilities, they’re controllable.
Looking at them together gives operators a clear view of overall efficiency. For example, if labor creeps up but food waste drops, your prime cost may still be in line. That’s why many experts consider it the most important financial benchmark for restaurant performance.
Restaurants should aim to keep their prime cost between 55% to 65%, but, like all the industry benchmarks we’ve covered, this number can change based on concept, location, and offer.
Rent and occupancy costs as a percentage of revenue
Your rent, utilities, and all other facility-related expenses should ideally fall between 5% to 10% of revenue.
The challenge is that rent and associated costs can vary widely depending on location. For example, a pizza shop in Manhattan will have a much higher square footage cost compared to a suburban strip mall in Ohio; however, the high sales volume in a busier market can help balance this out.
Operational Benchmarks That Drive Efficiency

Your financial success hinges on the day-to-day efficiency of your restaurant’s operations. These are some of the most common operational benchmarks worth tracking.
Table turnover time by restaurant type
Table turnover time measures how long it takes for a table to go from seated to reset for the next guest. The right benchmark depends on your restaurant type:
- QSR: 30min to 1hr
- Full service restaurant (FSR): 1hr, 15min
- Fine dining establishments: 2hrs
If table turnover is too slow, you’re potentially losing out on larger margins; however, if table times are too fast, diners might be feeling rushed, which can damage the customer experience.
Using these industry benchmarks to find the sweetspot in table turnover can help you balance volume with hospitality.
Inventory turnover and waste reduction
Inventory turnover measures how often you use and replenish your inventory over a given period. Most restaurants aim to turn inventory 4 to 8 times per month, depending on concept and menu. A higher turnover rate typically means better efficiency and less spoilage.
In tandem, tracking food waste, typically 4% to 10% of food purchases, can reveal hidden issues like over-ordering, improper prep, or portioning problems. Together, these metrics help you control costs and improve sustainability.

Staff productivity metrics
As we’ve covered, staffing (labor) is typically your largest expense, which means measuring productivity from multiple angles gives a clearer picture of your operations.
Two useful benchmarks to track are:
- Sales per hour labor: Simply divide total sales for a period by the total hours worked for that same period. This number can vary depending on your concept, but most operators shoot for around $45 an hour.
- Covers per server per shift: How many tables or guests a server handles during a typical shift. You’ll need to track how your servers perform over time, as there are so many variables involved based on your service model, layout, and staffing approach, but it can vary anywhere from 18 to 45 covers per shift.
These numbers help highlight whether your schedules match demand and whether additional training could improve efficiency.
Putting operational benchmarks to work
Individually, these numbers each show one piece of the puzzle. But used together, they reveal how one change can influence another.
For example, say you notice your table turnover times are lagging during lunch hours. That could indicate a bottleneck in the kitchen or slower order taking. By pairing that with labor productivity metrics, you might discover that an extra server during peak times could make all the difference.
These operational benchmarks don’t just highlight problems; they reveal solutions. The more closely you track them, the more control you have over your restaurant’s day-to-day flow and long-term performance.
Customer Experience Benchmarks To Watch

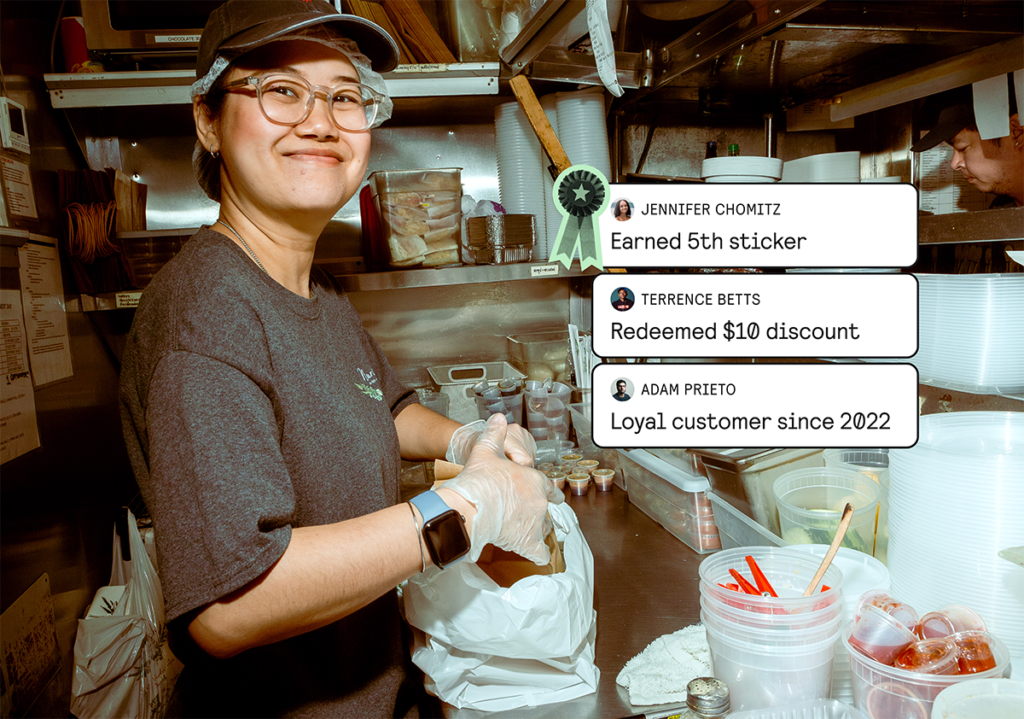
Customer experience benchmarks show how your guests perceive your restaurant and whether they’re likely to return. Since repeat business is what separates restaurants that survive from those that thrive, these numbers are every bit as important as your financial and operational data.
Average customer spend per visit
Your average check measures how much a guest spends each time they dine with you.
This number can vary widely depending on your concept, but tracking it over time tells you whether guests are ordering more, less, or about the same. Many operators also compare dine-in versus takeout and delivery to see which channels are most profitable and where upselling opportunities exist.

Customer satisfaction and review scores
Online ratings and review scores give you direct feedback on how you’re doing in the eyes of your guests.
Aiming for an average rating above 4.25 stars on major platforms is a healthy target. Anything lower risks turning new customers away before they’ve even tried your food.
Monitoring comments alongside scores also helps you spot recurring issues, like long wait times or difficulty with understanding the menu, that numbers alone can’t show.Loyalty program participation
Loyalty programs have become a cornerstone of customer retention. Industry benchmarks show that:
- 47% of loyalty program members use it several times a month
- 84% of users will stick with a brand because of a loyalty program
- Loyalty program customers spend 15% to 25% more annually
If your participation rate is lower, consider simplifying the sign-up process or offering more immediate rewards.
Delivery and takeout performance
With off-premise ordering making up a growing share of restaurant revenue, accuracy and speed have become critical benchmarks.
- Order accuracy rates should be 90% or higher
- Deliver times should be within 34 minutes to stay competitive
Falling short in either area can lead to bad reviews and lost repeat business.
Why customer-focused benchmarks matter
Your financial and operational data reveal how efficiently your restaurant is running, but your customer-focused benchmarks indicate how all of that translates into repeat orders and revenue.
Higher check averages, stronger review scores, and better loyalty engagement all point toward the same outcome: healthier, more reliable sales over time.
How to Put Industry Benchmarks Into Practice

Collecting benchmark data only matters if you turn it into action. Start by tracking your own numbers consistently, either weekly or monthly, for metrics like food and labor costs, and quarterly for bigger-picture trends such as profitability and customer satisfaction.
Comparing those results to the industry benchmarks you’ve learned in this article gives you context. For example, you can see whether a dip in profit margin or a rise in labor cost is a warning sign or simply in line with what others are experiencing.
From there, focus on what’s actionable. If food costs are climbing, check portioning or renegotiate vendor pricing. If table turnover is slow, look at staffing or order-taking speed.
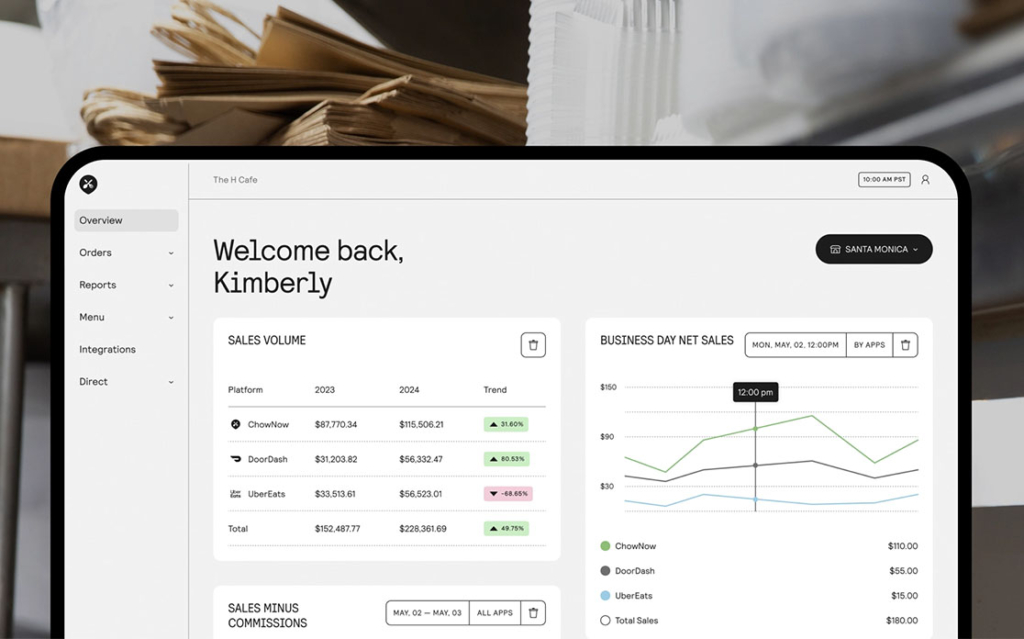
Technology makes this process easier than ever; most modern POS systems and back-office tools can automatically pull reports, track trends, and visualize changes over time.
The goal isn’t just to match industry averages—it’s to use benchmarks to find gaps, set goals, and continuously improve performance year after year.
Next Steps for Restaurant Operators Who Want to Level Up
Benchmarking isn’t a one-time project—it’s an ongoing habit that helps you make smarter decisions and stay ahead of the curve.
Contact ChowNow to learn how Centralized Reporting can make it easy to track performance, identify opportunities, and turn everyday data into smarter decisions that drive growth.
Restaurant Industry Benchmarks Frequently Asked Questions
What are the key performance metrics for restaurants?
The most important restaurant industry benchmarks help you measure both financial and operational health. Common examples include:
- Profit margin: how much of your total revenue becomes profit after expenses.
- Food cost percentage: what portion of sales goes toward ingredients.
- Labor cost percentage: how much revenue goes to wages and staffing.
- Prime cost: combines food and labor to show overall efficiency.
Customer-focused metrics like review ratings, loyalty participation, and delivery accuracy also reveal how well your restaurant performance translates into guest satisfaction and repeat business.
How do I benchmark my restaurant’s performance?
To benchmark restaurant performance, start by collecting financial and operational data from your POS or accounting system. Then compare those numbers to published industry benchmarks for restaurants with a similar concept and size. The goal is to identify where your profit margins and cost percentages are outperforming or falling short, and use those insights to guide targeted improvements.
What is a good food cost percentage for restaurants?
A healthy food cost percentage for most restaurants ranges from 25% to 35% of total sales. The right number depends on your menu offerings, location, and overall restaurant concept, but staying within this range keeps profit margins sustainable and supports long-term restaurant performance.
How often should I compare my restaurant to industry benchmarks?
Most operators review their benchmarks monthly or quarterly to track meaningful trends. Reviewing too rarely makes it hard to spot issues early, while doing it too often can create noise. A consistent schedule gives you reliable data to measure progress and adjust before small problems grow.
Where can I find updated benchmarks for my type of restaurant?
You can find credible restaurant industry benchmarks from the National Restaurant Association, state and local restaurant associations, and accounting or consulting firms that publish annual reports. Internal data from your POS or back-office software is also valuable for comparing your own restaurant performance against these industry averages over time.