Restaurant KPIs Every Operator Should Track (With Easy-to-Use Formulas)

Running a restaurant without tracking your key metrics is like flying blind.
Sure, instincts matter, but let’s be honest, following your intuition is really just a guessing game, and eventually, a strong hunch will turn out to be a bad judgment.
With razor-thin margins and hundreds of moving parts, guessing your way through important decisions won’t cut it long term—that’s where you can leverage KPIs (Key Performance Indicators).
Restaurant KPIs are numbers that go beyond basic accounting to help you see how every part of your business is performing—from your profit margins to your guest experience.
In this article, you’ll learn:
- The most important restaurant KPIs for restaurant profitability, efficiency, and growth
- How to calculate and benchmark major KPIs using simple formulas
- Practical tips for tracking KPIs without getting overwhelmed
Let’s start by breaking down what KPIs are, and why they require your attention.
What Are Restaurant KPIs and Why Do They Matter?
Key performance indicators (KPIs) are the numbers that tell you how your restaurant is actually doing.
Think of them as your restaurant’s vitals: they help you monitor the health of your business in real time, so you know where to adjust operations before problems become expensive.
Instead of relying on gut feelings and guesswork, they give you clear, measurable data you can track over time to meet your key business objectives.
Not all restaurant KPIs measure the same thing—some help you protect your bottom line, while others can improve your operations efficiency or improve guest experience.
When used together, they give you a complete picture of how your restaurant is performing, showing you where the most significant opportunities are.
Let’s dig deeper into the 11 Key Performance Indicators every restaurant operator should track and know.
Financial KPIs: Measuring Profitability and Cost Control
Let’s start with restaurant KPIs that hit closest to home for every operator: the ones that tell you whether or not your business is thriving or just surviving.
Financial restaurant KPIs give you visibility into your costs, pricing, and ultimately, your profitability. If you’re only going to track a handful of key performance indicators, start with these.
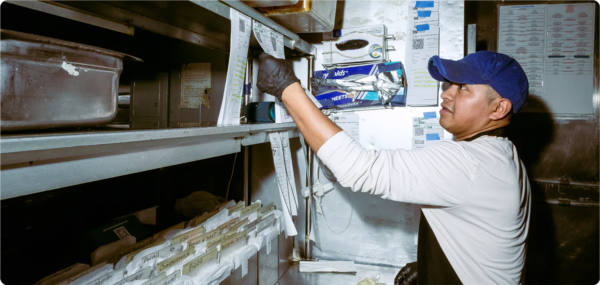
Cost of Goods Sold (COGS)
Cost of Goods Sold tells you how much it actually costs to make the food and beverage sales you sell. This includes kitchen ingredients, beverages, and packaging—basically, all of your raw materials.
COGS = Beginning Inventory + Purchases – Ending Inventory
To calculate your Cost of Goods Sold, you start with the value of your inventory at the beginning of a set period, add any new purchases you’ve made during that time, then subtract the value of your remaining inventory at the end of the period.
If your Cost of Goods Sold is too high, your profit margins suffer—no matter how packed your dining room is.
Monitoring your COGS helps you spot food waste, theft, over-ordering, or supplier price hikes before they eat into your gross profit margin.
A typical COGS for a restaurant is around 30%-40%, depending on your concept and pricing.

Labor Cost Percentage
Labor is one of the biggest controllable expenses in the business, and it can spiral quickly if you’re not watching it. Labor Cost Percentage includes total labor costs such as hourly wages, salaried staff, taxes, and benefits.
Labor Cost Percentage = (Total Labor Costs ÷ Total Sales) x 100
Add up all your labor-related costs for a given period, then divide that number by your total sales for the same period, and multiply by 100 to get the percentage.
Balancing labor cost percentage and staffing levels is a daily dance.
Too many people on the floor?
You’re paying for idle time.
Too few?
You risk long wait times and a drop in service quality.
Aim to keep labor costs between 20% to 30% of total sales, depending on your service style and local wage laws.
If you’re wondering why you multiply by 100 after dividing labor costs by total sales, it’s to turn the decimal result into a percentage.
For example: If labor costs = $4,000 and sales = $10,000, then 4,000 ÷ 10,000 = 0.4
That 0.4 means labor costs are 40% of your sales, but written as a decimal.
To turn 0.4 into 40%, you multiply by 100.
You can use this same method to calculate the percentage for most KPIs.

Prime Cost
Prime cost is the combined total of your two biggest expenses: food (COGS) and labor costs. This is the number many operators obsess over, and for good reason.
Prime Cost = COGS + Labor Costs
To calculate prime costs, add your total Cost of Goods Sold (COGS) and total labor costs—including wages, salaries, taxes, and benefits—for a given period. Then divide that number by your total sales and multiply by 100 to get the percentage.
It’s the most direct snapshot of how efficiently you’re running your restaurant day to day.
If your prime cost is out of whack, profitability becomes an uphill battle. Most successful operators aim to keep it under 60–65% of total sales.

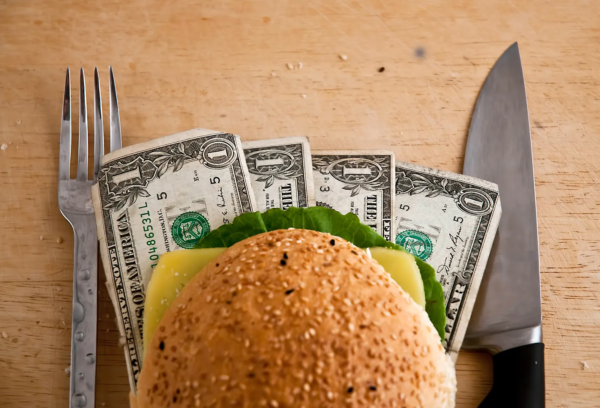
Gross Profit Margin
Gross Profit Margin = (Total Sales – COGS) ÷ Total Sales
To calculate Gross Profit Margin, subtract your total Cost of Goods Sold (COGS) from your total sales to get your gross profit. Then divide that number by your total sales and multiply by 100 to get the percentage.
This metric will tell you how much money you’re keeping after covering the direct costs of making the food you sell—aka, your Cost of Goods Sold (COGS).
This does not include things like rent, labor, or marketing, just the costs directly tied to the food and beverages you’re serving.
A good Gross Profit Margin to shoot for is around 70%; if you’re not hitting that range, it might be time to revisit your menu pricing or renegotiate with suppliers.

Net Profit Margin
Net Profit Margin = (Total Revenue – Total Expenses) ÷ Total Revenue
Net Profit Margin reveals the percentage of revenue that remains as profit after all operating expenses are deducted, including food costs, labor, rent, utilities, and other overheads.
To calculate this metric, start with your total revenue for a given period. Subtract all your expenses to get your Net Profit. Now divide that number by your total revenue and multiply it by 100 to get your Net Profit Margin as a percentage.
It’s a critical indicator of your restaurant’s overall profitability, and even with strong sales, high operating expenses can eat into your bottom line.
Most restaurants aim for a Net Profit Margin around the 3%-9% range. If you’re consistently falling below that, it might be time to adjust your pricing, spending, or operations.

Operational KPIs: Efficiency and Guest Experience
Your financial restaurant KPIs tell you how much money you’re making, while your operational KPIs will tell you how smoothly your business is running and how your guests feel about it. Operational KPIs help you measure and manage various aspects of your restaurant’s operations.
These numbers are tied to the day-to-day experiences inside your restaurant, both on the floor and behind the scenes. Meeting and exceeding customer expectations is crucial for maintaining high levels of customer satisfaction and loyalty.
Table Turnover Rate
Table turnover rate shows how many guests you’re serving per table over a given time period during a shift or from open to close.
Table Turnover Rate = Number of Guests ÷ Number of Tables
To calculate your Table Turnover Rate, choose a time period (shift or a full day), then divide the total number of guests served by the number of tables in your restaurant. This will tell you how many times each table turned over during that period.
A higher table turnover rate means you’re serving more guests with the same seating capacity, which can increase revenue without raising costs.
If your table turnover rate is too low, it could mean slow service, inefficient seating, or long gaps between seatings.
Be aware, though, that if it’s too high, you might be rushing guests and sacrificing the customer experience.
The key is balance: turn tables efficiently, but not at the expense of hospitality.

Average Order Volume (AOV)
AOV tells you the average amount each customer spends per order every time they visit your restaurant.
Average Order Volume = Total Revenue ÷ Number of Orders
To calculate your AOV, take your revenue over a set period and divide it by the number of orders during that same period. The result is your AOV.
You can use AOV to understand your customers’ spending habits, how menu changes and upsells are impacting your bottom line, and use it as a starting point for setting sales goals.
To learn how to boost your AOV, read our article 7 Strategies To Increase Your Restaurant’s Average Order Volume (AOV).

Order Accuracy Rate
No one likes getting the wrong dish, especially your kitchen staff, who now have to remake it quickly, pushing back the orders they’re currently working on.
Order Accuracy Rate = (Total Correct Orders ÷ Total Orders) x 100
To calculate Order Accuracy Rate, track the total number of orders in a given period and how many were successfully delivered without errors. Divide the number of correct orders by the total number of orders and multiply by 100 to get your Order Accuracy Rate as a percentage
Bad Order Accuracy is a silent killer of profit margins: it eats up twice the food and twice the time.
A low accuracy rate means something’s off in your communication chain, whether it’s POS errors, rushed order entry, or unclear kitchen tickets.
Tracking this restaurant KPI can help you pinpoint where mistakes are happening and fix the process, not just the plate.

Marketing and Online Ordering KPIs
Don’t believe that marketing KPIs are only for big chains with massive budgets—restaurants of any size can use these KPIs to see what’s working, where your guests are coming from, and how to keep them coming back.
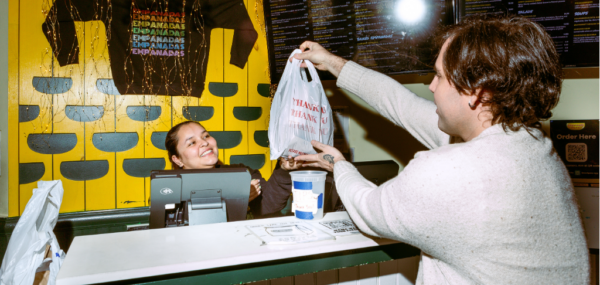
Direct vs. Third-Party Order Volume
Third-party platforms might help you reach more diners, but they come with a heavy price, sometimes as much as 30% per order.
That’s why tracking the balance between direct and third-party orders is important so you can evaluate the long-term health of your online sales. The more customers you can shift to direct ordering, the better your profits will look.
Tools like ChowNow’s Centralized Reporting can give you a clear view of all your online ordering channels from one easy-to-read dashboard—no more switching between platforms trying to collect, compare, and make sense of the data.

Customer Retention Rate
Acquiring new customers is expensive. Keeping existing ones is where the real profit lies—80% of sales often come from just 20% of your guests.
And that 20% is primarily made up of your repeat customers.
So it’s simple: boost your Customer Retention Rate, and you’ll grow your sales and increase satisfied customers.
But to do that, you need to track and understand what’s driving guests to come back. That’s why your Customer Retention Rate is worth watching.
Customer Retention Rate = ( Returning Customers ÷ Total Customers) x 100
To calculate your Customer Retention Rate, choose a time period, like a week, month, or quarter. Then look at how many of your customers during that time were returning guests vs. total unique customers. Divide the number of returning customers by the total number of customers, then multiply by 100 to get your Customer Retention Rate as a percentage.
It gives you a sense of how well your marketing, service, and overall guest experience are building long-term relationships—not just one-time transactions.
Restaurants that see the highest Customer Retention Rates are often paired with strategies like a rewards program or automated email marketing to pull customers back in.
To learn more about customer retention, read our article 5 Essential Restaurant Customer Retention Strategies Every Operator Needs.

Email Marketing KPIs (Open Rate, Click-Through Rate)
Email remains one of the most cost-effective ways to stay in front of your customers. But to know whether your campaigns are actually working, you need to track how many people open them—and how many click through to take action (like placing another order).
For restaurant operators, a healthy Email Open Rate is typically around 35%, meaning over a third of the customers who got your email opened it because they liked the subject line and it was good timing.
A good Click-Through Rate (CTR), meaning the recipient opened your email and clicked a link, is around 1%, which I know sounds small, but even a single percentage point can represent dozens, or hundreds, of repeat orders depending on the size of your list.
Restaurants that see the most success use email marketing tools. For example, ChowNow’s Automated Email Marketing helps you stay in touch with customers with minimal effort.
Just set it up, and customers are automatically sent emails when they place an order, haven’t ordered in a while, or join your list—so you’re always top of mind without having to lift a finger.
To learn more about email marketing, read our Guide to Restaurant Email Marketing.
How to Track KPIs Consistently Without Getting Overwhelmed
You don’t need to track every single restaurant KPI to run a successful business; in fact, trying to monitor too many KPIs at once can leave you feeling more stressed than informed.
The secret isn’t tracking everything, it’s tracking the right things, and do it consistently enough you can take action.
- Want to improve profitability? Watch Prime Cost, Labor, and Gross Margin.
- Trying to increase online business? Keep an eye on your direct order volume and AOV.
- If you want a smoother service, look at your table turnover and order accuracy.
For example, you can calculate food cost percentage to manage restaurant profitability.
The key is to choose KPIs that directly support your restaurant’s goals. Let your priorities guide the data, not the other way around.
Here are a few ways to make restaurant KPI tracking sustainable:
- Keep it simple: Use a centralized dashboard or spreadsheet to highlight your core KPIs.
- Build a rhythm: Weekly or monthly reviews are usually enough.
- Make it a team effort: Share key restaurant KPIs with your staff and review them together; they’ll feel more invested in the results.
Consistency is more important than complexity, so when you track the right KPIs, they stop being just numbers and start becoming your signals for how to run a stronger, more efficient restaurant.
Your Restaurant’s Data is Telling a Story—Pay Attention
Every restaurant KPI is a part of a pattern, and the sooner you start listening to what the numbers are telling you, the faster you can start rewriting your restaurant’s story in your favor.
Contact ChowNow to learn how Centralized Reporting tools can help you track online sales KPIs so you can make informed decisions faster.
Restaurant KPIs Frequently Asked Questions
What are restaurant KPIs?
Restaurant KPIs (Key Performance Indicators) are measurable data points that help operators evaluate performance across finances, operations, marketing, and guest satisfaction. These metrics help you make informed decisions instead of relying on gut feelings.
Why are restaurant KPIs important for restaurants?
KPIs give you visibility into your restaurant’s health. They help identify inefficiencies, track profitability, and guide strategy. Without them, you’re making decisions based on assumptions rather than data.
What are the most important KPIs for restaurant profitability?
The most important financial KPIs for profitability include Cost of Goods Sold (COGS), Labor Cost Percentage, Prime Cost, Gross Profit Margin, and Net Profit Margin. These KPIs help you monitor expenses and protect your bottom line.